
Data lake · Business intelligence · AI analyst
Your data lake, with an AI analyst on top.
We turn the systems you already run, clinical, claims, ERP, CRM, point of sale, subscription platforms and spreadsheets, into a governed data lake, then put live dashboards and an AI analyst on it that leadership actually uses. You see it working on your own data before you commit.
- Proven on your own data first
- Cloud hosted and managed
- Security and governance built in
The problem
Plenty of data. Nowhere to ask a question.
The weekly numbers live in a workbook on one person's desktop. Dozens of scripts get run by hand before every leadership meeting. Two systems describe the same customers and share no common key, so nobody can say how far they overlap.
Everyone trusts the KPI workbook and nobody can reproduce it. A question that should take a minute takes a week, and by the time it is answered the meeting has moved on. None of that is a data problem. It is a plumbing problem, and it is fixable in weeks.
What you get
One trusted copy of your numbers, and someone to ask.
Your systems keep running exactly as they do today. We take a safe copy of what they hold, rebuild the definitions your business already uses, and put dashboards and an analyst on top of them. Nothing here is specific to one industry.
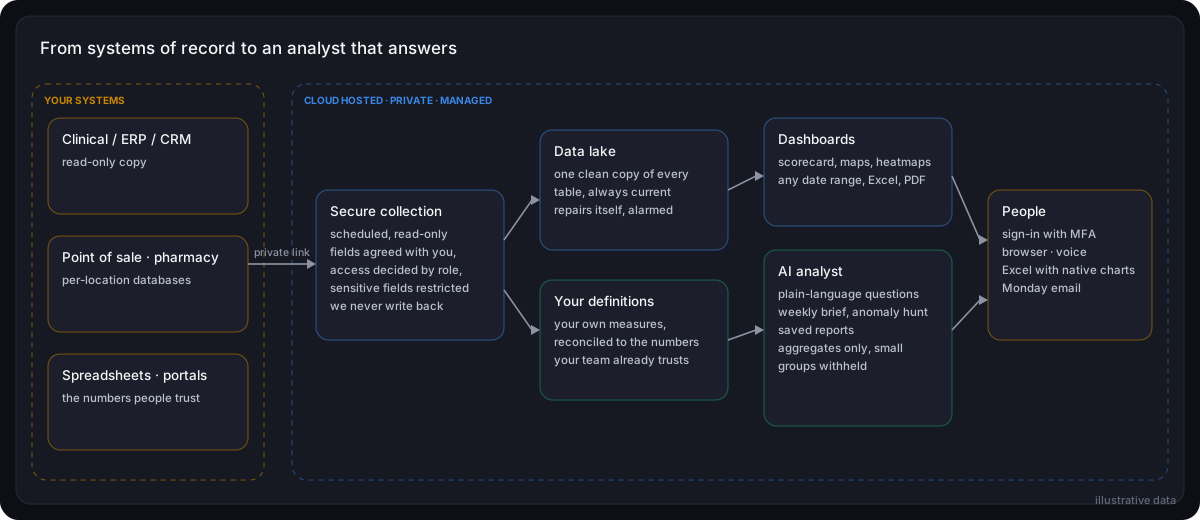
Collected safely
We read from your systems on a schedule and never write back to them. What comes across is agreed with you up front, and who can see it is decided by role.
One version of the truth
Your own definitions, rebuilt and reconciled against the numbers your team already trusts, week by week, before anyone sees a dashboard. The same question gives the same answer every time, and a load that fails overnight fixes itself before morning.
Dashboards leadership uses
The scorecard they already know, live, plus the views a spreadsheet could never hold. Any date range, any chart redrawn as a line, bar or table, and every page out as Excel with editable charts, or as PDF.
An analyst who answers
Ask in plain language, by text or by voice, and get a written brief every Monday. Every measure is checked each week for anything unusual, and each one comes back with what happened, the likely driver, the evidence, and what we suggest you do about it.
Dashboards
What leadership sees on a Monday morning.
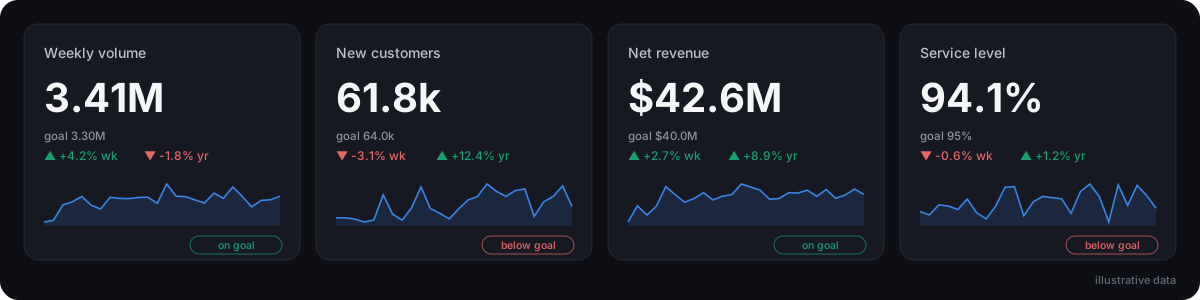
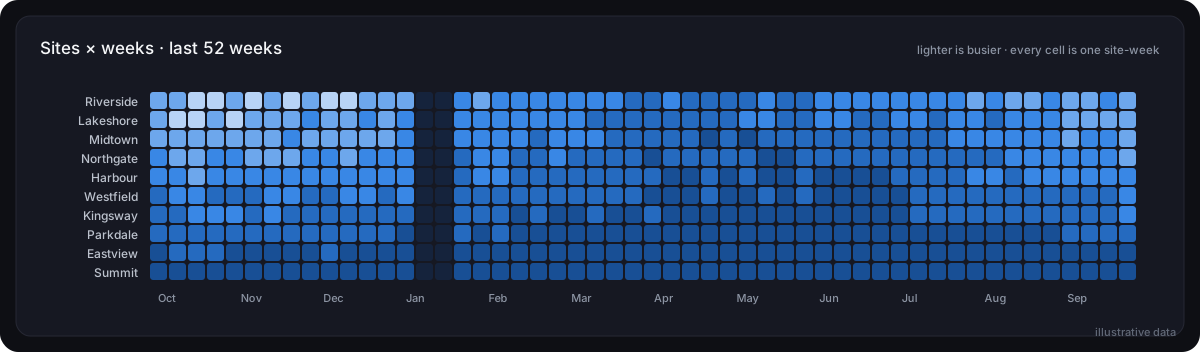
The KPI row they already know, with week on week and year on year movement and goal status against plan. Then the views a workbook cannot hold: ten sites by fifty-two weeks in one grid, fifty providers on one axis with any one of them isolated in a click.
Forecasts and saved answers
A forecast that publishes its own accuracy.
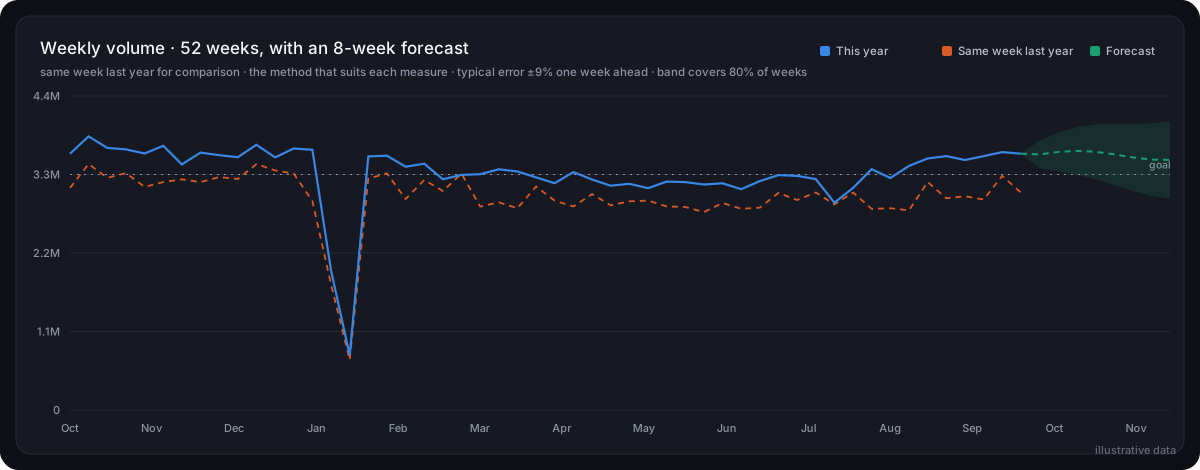
Most forecasts ask you to trust them. Ours states, on the chart, how wrong it has been. Every measure is forecast the way that measure's own history says works best, and the error is printed next to the line.
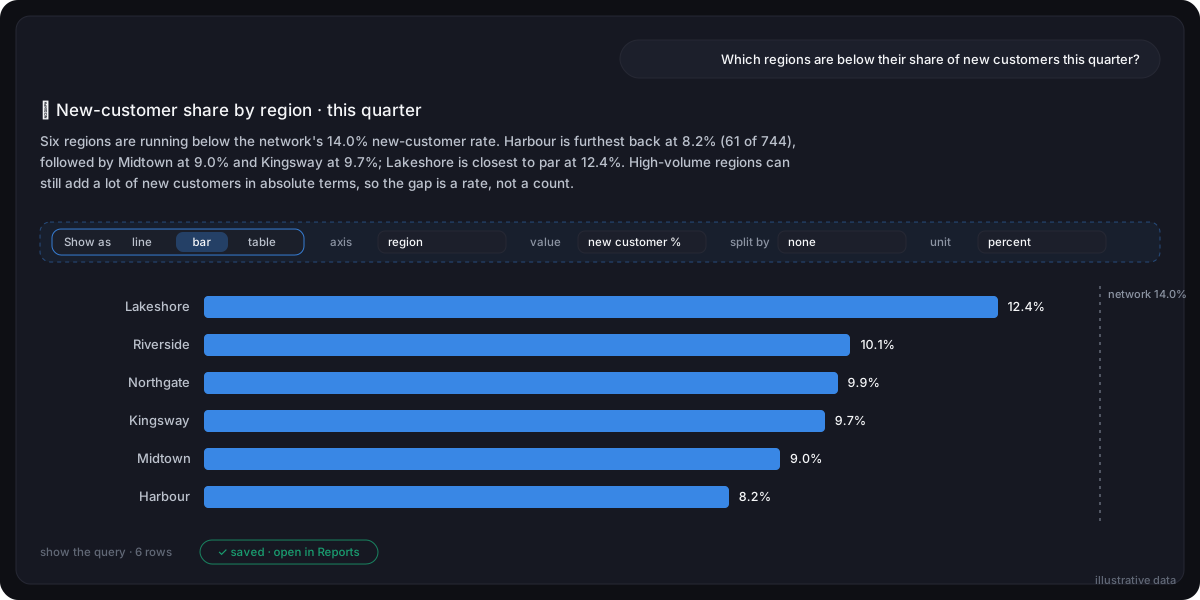
Any answer can be saved as a report that brings itself up to date whenever it is opened, in whichever chart style the reader chose.
Catchment
Where your customers actually are.
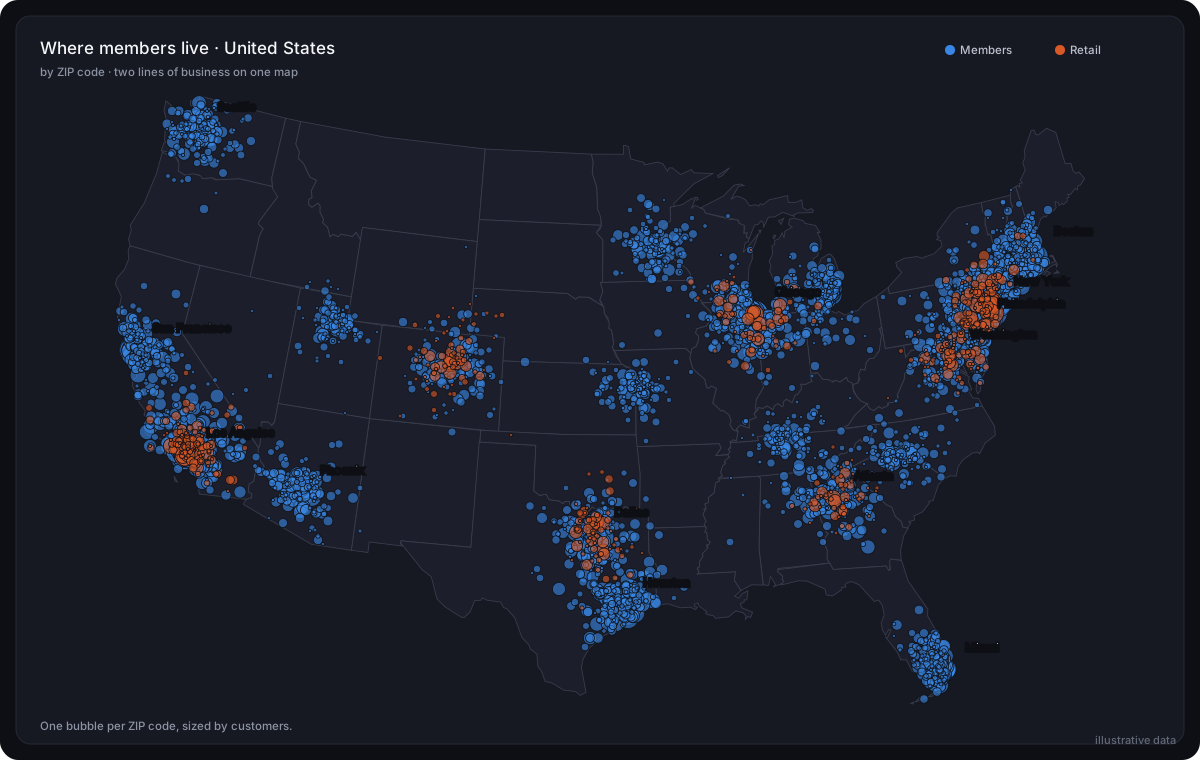
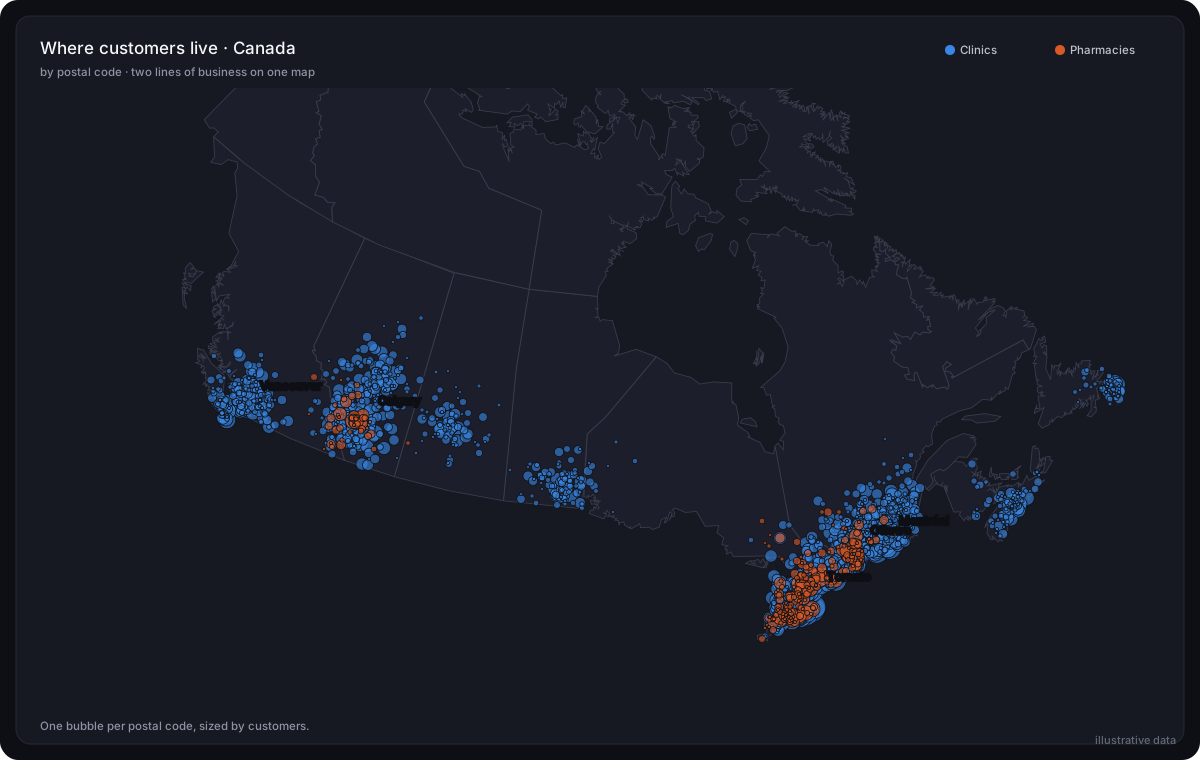
Catchment by location, ZIP code in the United States and postal code in Canada, with two lines of business on the same map and area names rather than codes. It is usually the first thing a leadership team leans in for, because it is the one view nobody has ever been shown.
Customer overlap
Two systems, no shared key.
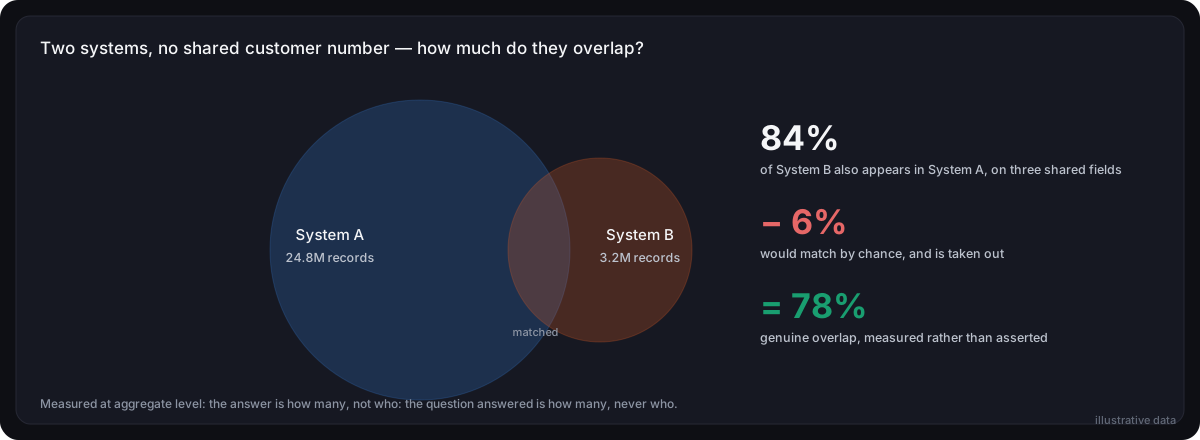
Most organizations hold the same customers in two systems with nothing in common to join them on, which is why nobody can say how far the two overlap.
We can measure it, correct for the matches that are pure coincidence, and give you a number you can act on. It answers how many, never who. It turns a question most organizations have never been able to answer into a number they can plan against.
What it does
What the platform holds itself to.
These are characteristics of the platform itself. Measured proof is in the case study.
Coverage
Every system of record
Clinical, billing, ERP, CRM, point of sale, subscription platforms and the spreadsheets beside them, brought into one governed lake and reconciled together. Integrating separate systems is the hard part, not the size of any one of them.
Scale
Sized to you
The same design carries a single department or a group of companies, nightly loads from systems of record and continuous event streams from the consumer platforms we run ourselves. Adding a source adds a source. It does not rebuild the platform.
Accuracy
Reconciled before you see it
Every measure is rebuilt and reconciled against the figures your team already trusts, week by week, before anyone is shown a dashboard. Nothing goes live on a number your team cannot recognize.
Independent check
Re-derived from raw
Before the platform is demonstrated, every headline number is re-derived independently, straight from the raw data, rather than read back from the same views that produced it.
Forecast error
Stated, not hidden
Every measure is forecast the way its own history says works best, and the chart prints the measured error beside the line instead of leaving you to assume it.
Speed
Under a second
To serve a page from a warm cache. A new analyst question is answered in under a minute, and a period nobody has asked for before is instant once it has been asked once.
Proof before commitment
Your own data first
A live demo running on your own real data, before any commitment is asked for.
Reliability
No silent failures
The lake keeps one clean copy of every table, repairs itself after an interrupted load, and raises an alarm if it could not.
Security and governance
Controls set to your policy, not ours.
For regulated buyers this is usually what decides the engagement, so it is built into the platform rather than promised around it.
Cloud hosted and managed by us, with private connectivity to your source systems and MFA enforced before any page is served
Read-only access to the systems we read from. The platform never writes back to them
Role based access decides who sees what, so your teams get the depth they need internally while sensitive fields stay restricted
The analyst reads only the views you approve, never writes, and shows the query behind every answer, so any number can be traced back
Aggregation and suppression thresholds are configured to your own policy, including none at all where your teams need detail
A saved report is checked against the current rules every time it is opened, so it cannot outlive the policy it was written under
By sector
What it answers in your business.
The platform is not industry software. These are the questions it has been pointed at, or is being pointed at next.
Healthcare networks
Visits, referrals and revenue by site and provider against goal. Who the patients are and where they live. Which sites retain patients and which quietly lose them.
Insurance and payers
Members by region and plan, claims volumes and lag, the overlap between books of business, and early warning when a line moves off trend.
Pharma and life sciences
Dispensing and prescribing patterns by region and prescriber segment, program enrollment against target, and field activity against outcomes, all at aggregate level.
Manufacturing
Output, scrap and downtime by line and shift against plan, with the forecast and its error stated, and the weekly anomaly scan standing in as a quality watch.
Distribution
Fill rate, order lines and lead time by warehouse and route, customers by area, and which accounts overlap between divisions.
Retail and B2C
Sales and new customers by store and week, catchment maps, cohort retention, and the overlap between the loyalty file and the e-commerce file.
Media and subscriptions
Subscribers, churn and engagement by title, plan and region, with a Monday brief that says what moved and why. We run this on our own products. Mosiky and Spell Movies are multicultural streaming platforms we own and operate, both in production and both feeding the same lake, which means the signal we work with is language, region and cultural preference rather than one national average.
Engagement
Three phases to a demo on your own data.
No commitment is asked for until you have seen your own numbers in it.
Phase 1. Access
Read-only access to the systems that hold your numbers, and agreement on exactly which fields are in scope.
Phase 2. Your definitions
Your measures rebuilt and reconciled week by week against the figures your team already trusts.
Phase 3. Dashboards and analyst
The scorecard live, plus the maps, the heatmaps and the forecasts, with the analyst held to the same rules.
Then the demo
A live session on your real data. What happens next is your decision, taken with the platform already working.
On offer after that
A scheduled brief by email every Monday
Additional source systems added to the lake
Native iPhone, iPad and Android apps
Customer-editable queries under a retainer
Spell Intelligence
Already running Spell products?
If your systems of record are already Spell products, the same intelligence arrives without a separate build. Spell Intelligence is the governed layer across the Spell platform: shared metric definitions, cross-product dashboards, and Spella answering inside the product your team is already in.
See it on your own data
Tell us which systems hold your numbers today and what your leadership team asks for every week. We will come back with the extraction plan, what it will cost to run, and a date for the demo.